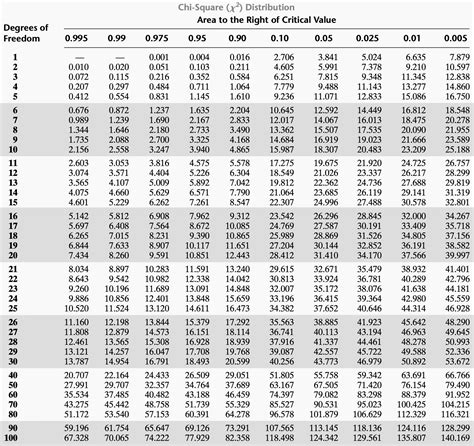
Chi Distribution Table

The Chi Distribution, also known as the Chi-Squared Distribution, is a widely used statistical distribution in hypothesis testing, confidence intervals, and regression analysis. It is particularly useful in analyzing categorical data and testing hypotheses about proportions. The Chi Distribution Table, also known as the Chi-Squared Table or Chi-Squared Distribution Table, provides the critical values of the Chi-Squared statistic for different degrees of freedom and significance levels.
Understanding the Chi Distribution Table

The Chi Distribution Table is a statistical table that lists the critical values of the Chi-Squared statistic for different degrees of freedom and significance levels. The table is used to determine the critical region for a hypothesis test, which is the region where the null hypothesis is rejected. The critical values in the table are based on the Chi-Squared distribution, which is a continuous probability distribution that is commonly used in statistical analysis.
Interpreting the Chi Distribution Table
To interpret the Chi Distribution Table, you need to understand the concept of degrees of freedom and significance levels. Degrees of freedom refer to the number of independent observations or pieces of information used to calculate a statistic. Significance levels, on the other hand, refer to the probability of rejecting the null hypothesis when it is true. The most common significance levels are 0.01, 0.05, and 0.10. The critical values in the table are determined by the degrees of freedom and the significance level.
| Degrees of Freedom | Significance Level (0.01) | Significance Level (0.05) | Significance Level (0.10) |
|---|---|---|---|
| 1 | 6.635 | 3.841 | 2.706 |
| 2 | 9.210 | 5.991 | 4.605 |
| 3 | 11.345 | 7.815 | 6.251 |
| 4 | 13.277 | 9.488 | 7.779 |
| 5 | 15.086 | 11.070 | 9.236 |

Key Points
- The Chi Distribution Table is used to determine the critical region for a hypothesis test.
- The critical values in the table are based on the Chi-Squared distribution.
- The table is used to determine the critical region for different degrees of freedom and significance levels.
- The most common significance levels are 0.01, 0.05, and 0.10.
- The critical values in the table are determined by the degrees of freedom and the significance level.
Using the Chi Distribution Table in Hypothesis Testing

The Chi Distribution Table is widely used in hypothesis testing, particularly in testing hypotheses about proportions. The table is used to determine the critical region for a hypothesis test, which is the region where the null hypothesis is rejected. The critical values in the table are used to calculate the test statistic, which is then compared to the critical value to determine whether the null hypothesis is rejected.
Example of Using the Chi Distribution Table
Suppose we want to test the hypothesis that the proportion of defective products in a manufacturing process is less than 0.05. We take a random sample of 100 products and find that 3 of them are defective. We can use the Chi Distribution Table to determine the critical region for this hypothesis test. Assuming a significance level of 0.05, we can look up the critical value in the table for 1 degree of freedom, which is 3.841. We can then calculate the test statistic and compare it to the critical value to determine whether the null hypothesis is rejected.
Advantages and Limitations of the Chi Distribution Table
The Chi Distribution Table has several advantages, including its ability to provide critical values for different degrees of freedom and significance levels. However, it also has some limitations, including its assumption of a normal distribution and its sensitivity to outliers. Additionally, the table is not suitable for small sample sizes, and alternative methods, such as simulation or bootstrapping, may be necessary.
Alternatives to the Chi Distribution Table
There are several alternatives to the Chi Distribution Table, including simulation and bootstrapping methods. These methods can provide more accurate results, particularly for small sample sizes or non-normal distributions. Additionally, some statistical software packages, such as R or Python, can provide exact p-values and critical values for hypothesis tests, eliminating the need for the Chi Distribution Table.
What is the Chi Distribution Table used for?
+The Chi Distribution Table is used to determine the critical region for a hypothesis test, particularly in testing hypotheses about proportions.
How do I interpret the Chi Distribution Table?
+To interpret the Chi Distribution Table, you need to understand the concept of degrees of freedom and significance levels. The critical values in the table are determined by these two factors, and using the wrong critical value can lead to incorrect conclusions.
What are the advantages and limitations of the Chi Distribution Table?
+The Chi Distribution Table has several advantages, including its ability to provide critical values for different degrees of freedom and significance levels. However, it also has some limitations, including its assumption of a normal distribution and its sensitivity to outliers.
Meta Description: The Chi Distribution Table is a statistical table used to determine the critical region for hypothesis tests, particularly in testing hypotheses about proportions. Learn how to interpret and use the Chi Distribution Table, its advantages and limitations, and alternatives to the table. (145 characters)


