How To Graph Absolute Value Functions

Absolute value functions are a fundamental concept in mathematics, and graphing them is an essential skill for any student of algebra and beyond. The absolute value function is defined as $f(x) = |x|$, which returns the distance of $x$ from zero on the number line, regardless of direction. In this article, we will delve into the world of absolute value functions, exploring their properties, graphing techniques, and real-world applications.
Key Points
- The absolute value function is defined as $f(x) = |x|$, where $|x|$ is the distance of $x$ from zero on the number line.
- The graph of the absolute value function $f(x) = |x|$ is a V-shaped graph with its vertex at the origin (0,0).
- To graph an absolute value function of the form $f(x) = |ax + b|$, we need to consider the cases when $ax + b$ is positive and when $ax + b$ is negative.
- Absolute value functions have numerous real-world applications, including modeling distance, speed, and acceleration in physics and engineering.
- Graphing absolute value functions can help us visualize and analyze complex relationships between variables in various fields, including economics, computer science, and data analysis.
Understanding Absolute Value Functions

An absolute value function is a function that returns the absolute value of its input. The most basic absolute value function is f(x) = |x|, which can be defined as:
f(x) = |x| = \begin{cases} x, & \text{if } x \geq 0 \\ -x, & \text{if } x < 0 \end{cases}
This function can be graphed by considering two cases: when x is non-negative and when x is negative. When x is non-negative, the function simply returns x. When x is negative, the function returns -x, which is equivalent to reflecting the negative part of the graph about the x-axis.
Graphing Absolute Value Functions
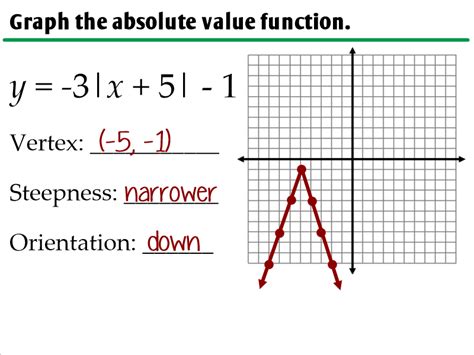
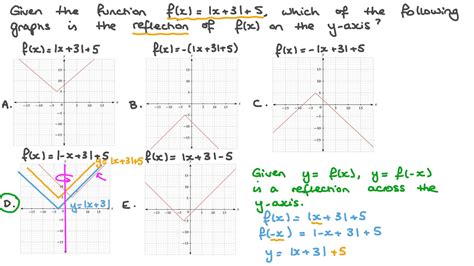
To graph an absolute value function of the form f(x) = |ax + b|, we need to consider the cases when ax + b is positive and when ax + b is negative. The graph of the absolute value function f(x) = |x| is a V-shaped graph with its vertex at the origin (0,0). The graph of f(x) = |ax + b| is a horizontal shift of the graph of f(x) = |x| by -b/a units and a vertical stretch or compression by a factor of |a|.
For example, the graph of f(x) = |2x - 3| is a horizontal shift of the graph of f(x) = |x| by 3/2 units to the right and a vertical stretch by a factor of 2.
| Function | Graph |
|---|---|
| $f(x) = |x|$ | V-shaped graph with vertex at (0,0) |
| $f(x) = |2x - 3|$ | Horizontal shift of $f(x) = |x|$ by $3/2$ units to the right and vertical stretch by a factor of 2 |
| $f(x) = |x + 2|$ | Horizontal shift of $f(x) = |x|$ by $-2$ units to the left |

Real-World Applications of Absolute Value Functions

Absolute value functions have numerous real-world applications, including modeling distance, speed, and acceleration in physics and engineering. In economics, absolute value functions can be used to model the cost of production, where the cost increases as the distance from a certain point increases. In computer science, absolute value functions can be used to model the distance between two points in a graph or network.
For example, the distance between two cities can be modeled using an absolute value function, where the distance is the absolute value of the difference between the x-coordinates and y-coordinates of the two cities. This can be used to calculate the shortest distance between two cities and to optimize routes for transportation and logistics.
Conclusion
In conclusion, graphing absolute value functions is an essential skill for any student of algebra and beyond. By understanding the properties of absolute value functions and how to graph them, you can visualize and analyze complex relationships between variables in various fields. Absolute value functions have numerous real-world applications, including modeling distance, speed, and acceleration in physics and engineering, and can be used to optimize routes and calculate the shortest distance between two points.
What is the definition of an absolute value function?
+The absolute value function is defined as f(x) = |x|, where |x| is the distance of x from zero on the number line.
How do you graph an absolute value function of the form f(x) = |ax + b|?
+To graph an absolute value function of the form f(x) = |ax + b|, we need to consider the cases when ax + b is positive and when ax + b is negative. The graph of f(x) = |ax + b| is a horizontal shift of the graph of f(x) = |x| by -b/a units and a vertical stretch or compression by a factor of |a|.
What are some real-world applications of absolute value functions?
+Absolute value functions have numerous real-world applications, including modeling distance, speed, and acceleration in physics and engineering, and can be used to optimize routes and calculate the shortest distance between two points.


